I am looking for a way to track / graph data such as temperature, humidity power consumption etc. preferably locally on the Vera itself or output to an external web server of my own.
I looked into Datamine but it appears un-maintained.
Same here, my Synology NAS runs several docker instances like InfluxDB to store time-series data.
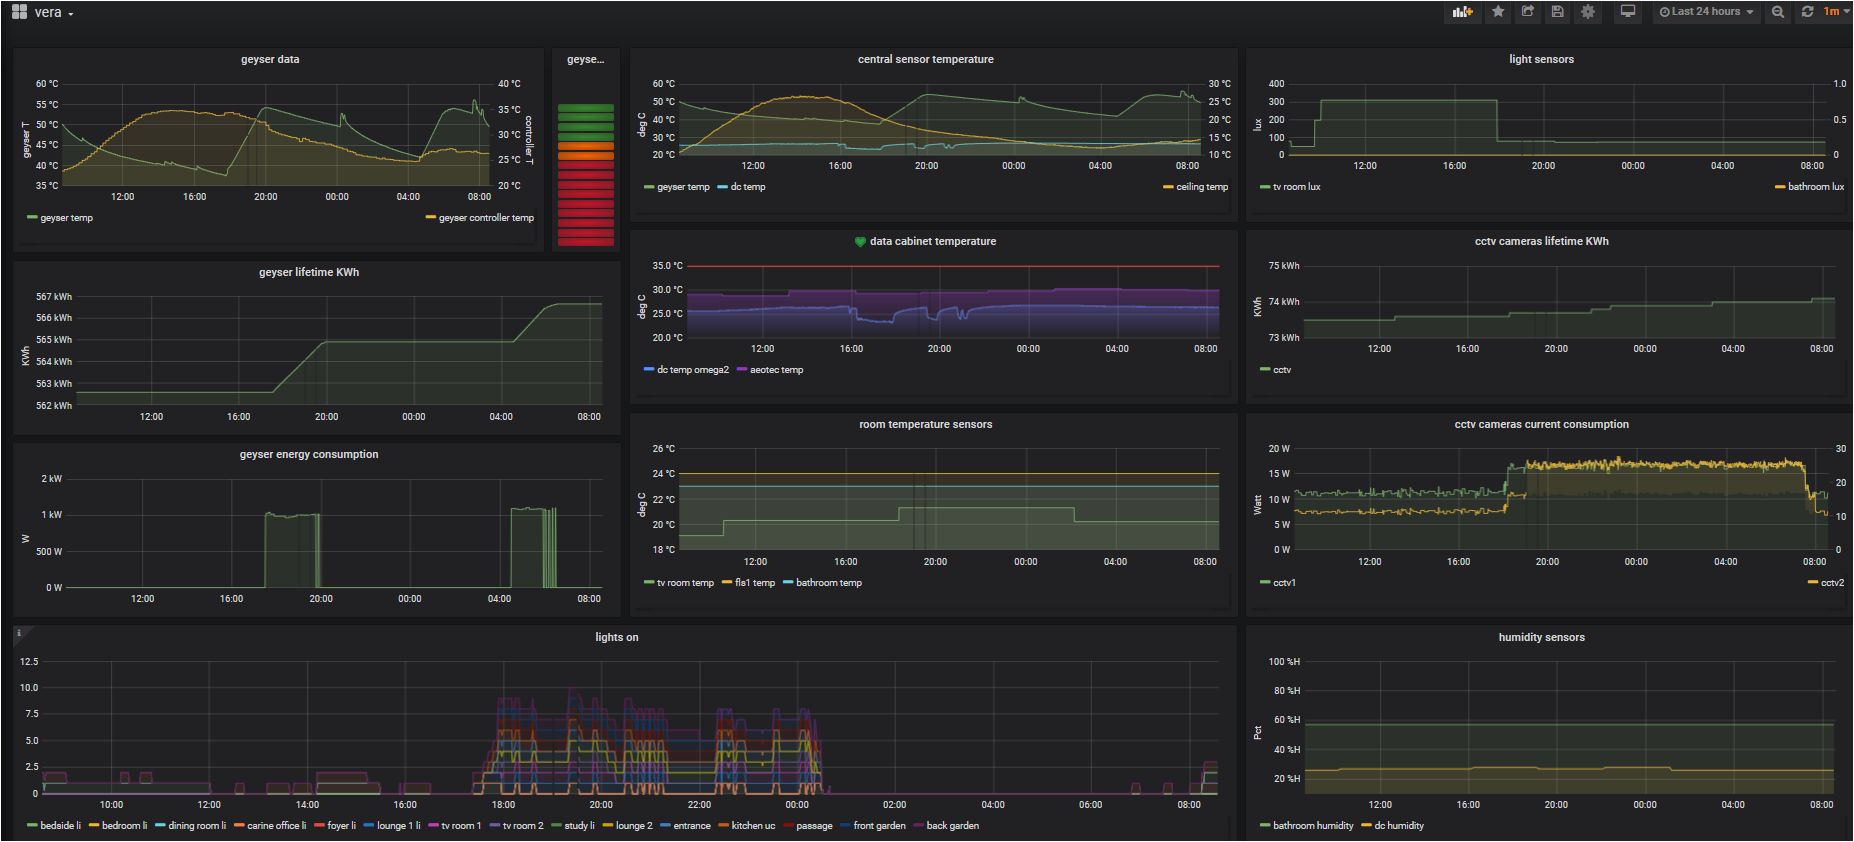
Running Grafana on top for some visualisations that includes power-consumptions, sensor-states (temperature, PIR-movements, light) or on-off indications of light-groups. Also VERA system metrics like CPU, memory etc are collected.
very flexible and rock steady for the past months without any hickup.
I have a RPI 4 CanaKit. I’m working to configure Wireguard for a few select devices to VPN to only, not my whole network. Do you think if I added Grafana with Wireguard running there’s enough resources on the RPI 4 to handle that?
First of all you need a Synology model “+” which is capable of running OR “Virtual Machines” OR “Docker” containers (with an Intel CPU)
There is no “package” click-click-click on Synology to make this happen …
There are quit many resources & youtube videos for installing this stack.
They often speak about the TICK stack because InfluxDB is just 1 of the components in a very popular stack of building blocks. T=Telegraf , I=InfluxDB , C=Chronograf , K=Kapacitor
Because the Vera plugin “inserts” directly into InfluxDB you don’t need “Telegraf” for example.
The other elements naar Chronograf is usefull to create / query etc on InfluxDB’s. Kapacitor is also not needed here.
Grafana is not mentioned here because its not really a part of the TICK-stack but an addon. There are similar applications like Grafana that will do the same, like Kibana, Prometheus, Graphite, Splunk, and NetData are the most popular
These are just 2 links with info…so much more info out there.
Hello and thanks for the tip!! Looking at your solution and @jvanhambelgium mention of Synology NAS I put together on my QNAP NAS instances of Docker, InfluxDB, Grafana and installed VeraFlux from @BlueSmurf on my VeraPlus. All of this not necessarily for the faint of heart, meaning it’s not Plug-n-Pray, but works like a champ. Thank you again !! Now to go off and play with Grafana to learn more how it thinks -bh
For lazy people like me Hundredgraphs.com with Vera plugin, set and forget
And if you are not, then node red, graphana and the rest, but that needs attention
I’ve set up Grafan on a RPi 3 and would not use it for any other heavy duty tasks. It’s quite capable, except if I want to see historical data for more than 7 days. A RPi 4 might be be able to handle the load sufficient. Why don’t you give it a try - it’s all free software and only some time needs to be invested. A good learning curve wither way and you can do everything if it does not work for you.
@ipstas, There’s merit to pushing data to the cloud and rolling your own… Just found that all startups initially have free/or cheap pricing then either they are bought by an established organization or the monthly cost is not worth the data (in my case in any case)
I’m picking up temperature data of my heating system into EMcms driven by two lines of code in Startup Lua and a file in the Luup files. Other types of attribues can also be pushed to EMcms.
For me it is a difference to spend 5 minutes to setup HundredGraphs account and do not care about administration in the future and couple days to set Docker, Grafana or Node Red and then to be your own linux admin.
And if the startup would go bust I am just losing these 5 minutes. Potentially losing collected data too, but with HundredGraphs you can download your own data anytime.
So in the end it is really a question of your playthings