Yes, figured it out after the fact, sorry about that.
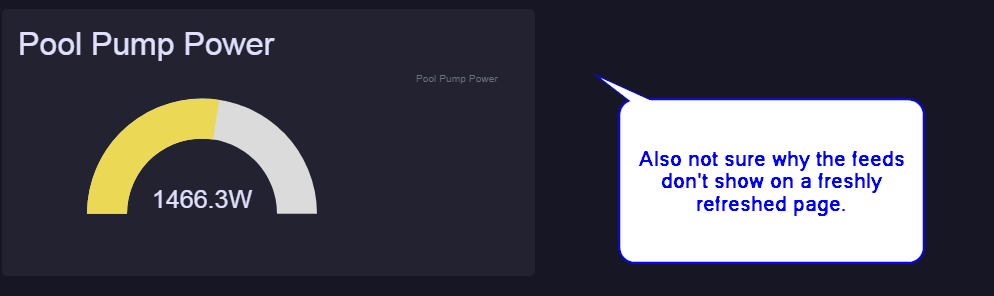
Correct, I have observed that the “reconnecting” is not reloading the charts and I often end up refreshing the page or going into a menu and back to the dashboard to get it to load.
Both app and site requires 2 taps to access the menu. First tap is like it has to have the menu object highlighted (you don’t see anything visually, just my guess), then second tap actually reveals the menu. I use Chrome mobile for Android, latest versions always. I have done cache clear and data clear in recent times.
I stated in the past in this thread that the colors are reverse. 100% wouldn’t be red for a gauge, the natural feeling of 100% would be green. This would look best for battery variables. For my pump power with wattage, a gradient of colors in either direction to pick from such as lower wattage is green, medium wattage moves to orange and higher wattages move to red.
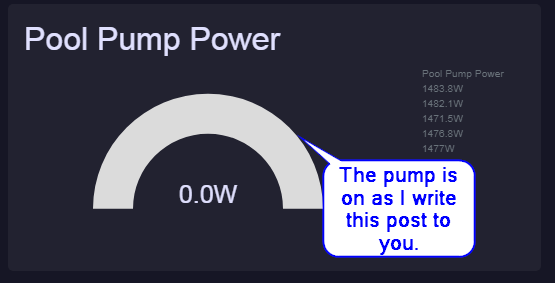
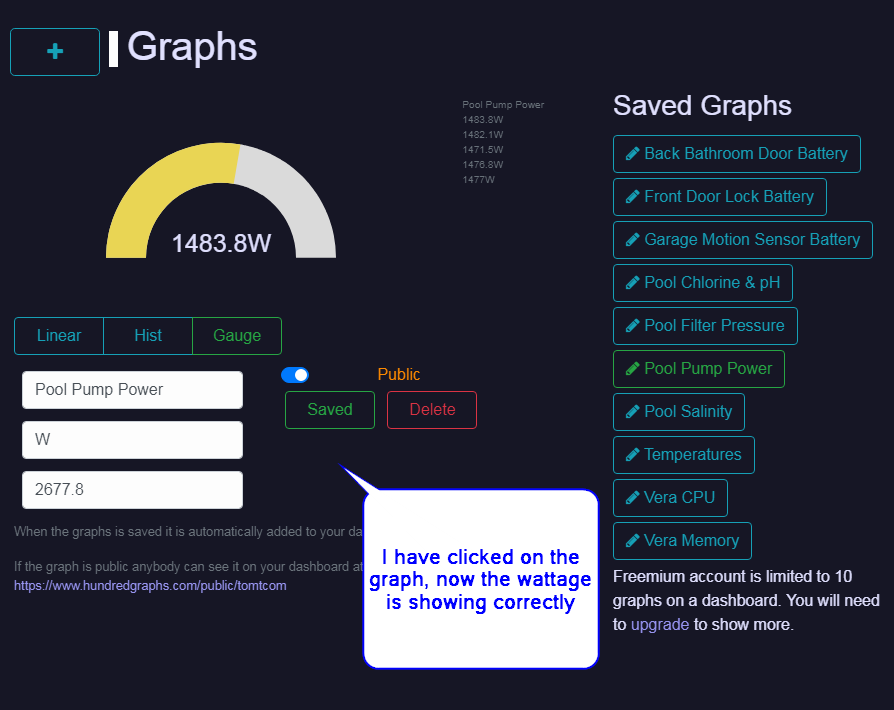
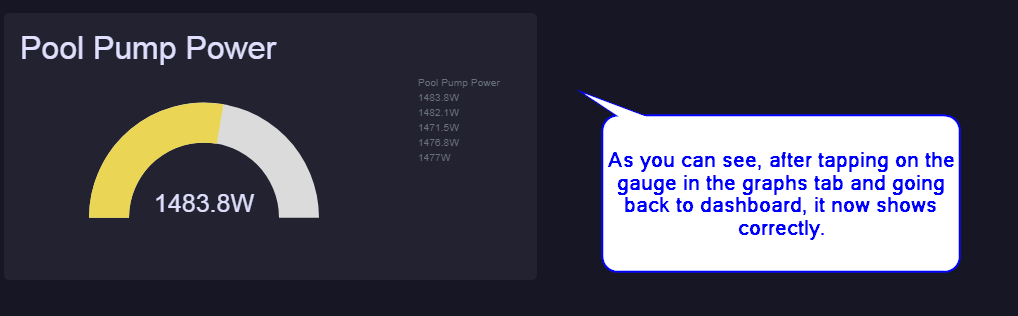
On a side note, I’ve used help on the site and the team has been fairly responsive. I have a ticket in with them (don’t remember the number) whereby a power gauge for my pump had been off for 3 hours but the gauge was showing 1400watts still. When you go to graphs, tap the pool pump graph, then go back to the dashboard it will repopulate correctly for a while and then it’s like it times out.
I switched my graphs to public at the request of the support person to view them. Use my username just like here on the forum (tomtcom).
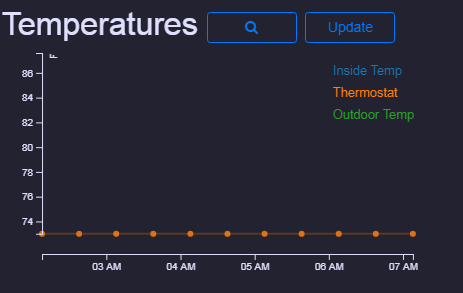
We have added a button for an update for linear graphs, and gauges are updated in real time. Unfortunately linear are a bit more complicated and requires aggregation on the server side and for now we can not make them real time. But you don’t need to refresh the whole page anymore, just click on an update button and that graph will be updated without page refresh.
Hopefully we will make it real time in the future after a hardware upgrade.
That should be fixed by now, can you please check it?
Colors are very debatable. Yes, the 100% of battery is definitely green, however 100% of power use is definitely red. We can offer two schemes maybe, the second is reversed of the existing one
THANK YOU! We have totally missed that bug, gauges were updating the right column with numbers but were not updating the gauge itself. It is fixed by now. Thanks again for bringing it up.
If using a linear graph and you do not check Average (uncheck it) either one or more feeds will not show on the graph. After putting all my graphs back to average they all worked.
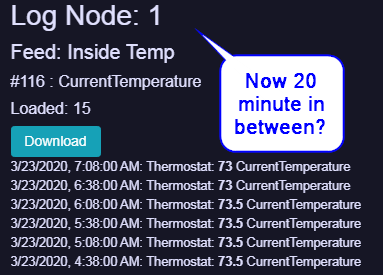
For the long-reporting interval:
You probably have 2.8 version which had that unintentional effect. If it can not reach the server for any reason it switches to 30 mins reporting instead of the configured interval. There is 2.10 in both stores, can you try to install it?
As for the average, we have just pushed the totally new version for the graphs. It should fix that bug and also it works much faster.
Thanks, I have 2.8 and the app is on auto update. 2.10 doesn’t yet show as an update but I’ll try that.
I’ve seen the new dashboard page and the update looks good.
Are you removing the ability to change the amount of data points displayed on the graphs? I notice it looks to show 24 hours only and no ability to increase or decrease the time interval.
If you get into the selected graph (with magnifying glass button) you can change the report from 24 hrs with 30 mins averaging (the usual) to minutes (pretty much real time as it goes with Vera) or to weekly. You also can slide into earlier dates.
We have added a binary type graph for cases when you need only open/close, up/down, etc.
Also a linear graph now got a ‘raw’ option, it would not average at all and just show values as it is.
We are working on a ‘Burst’ option so you can send data as soon as it happens. As for now Vera only sends the results from the polling at the time of the report. And it is possible to miss some motion sensors update when it opens and closes again between reports.
I also encourage to update to the latest version of plugin (2.10 as of today), we have tried to increase stability and error handling.
Please let me know if you fancy something else and we will try to accommodate.
Fonts and graphics are really coming together nicely. Looks quite professional.
Updated to 2.10.
I would like to know if once you open a graph and set the timeframe you want to see, can that be saved for the dashboard view? It resets when you leave the single graph view.
I’m not an expert with energy but can watts be converted to kilowatt hour and then multiply the cost of that kilowatt hour from the electric bill to determine the cost of the device?
I have more from my original moniton file which I can get tomorrow.
KWH from Watts is not really a problem and it is in our development plan. Together with the local electricity price and thus the final cost.
However it is preferable that you get this reading from the sensor directly, because we are inevitably missing one or two readings and then the result is not accurate. The KWH reporting from sensor is much more accurate.
It makes sense but not an issue for me, it would be more of a novelty to see roughly what the cost impact to the bill is. For example I have an external z-wave switch for a pool pump that does energy. Since this is far more worth knowing than some light I would still use it.
Here are my other examples of formulas and functions I used a while back:
local function cUptime(dev, sid, svar)
local secs = luup.variable_get( sid, svar, dev )
local endData = tonumber(secs)/86400
return endData
end
local function cLuupUptime( dev, sid, svar )
local now = os.time()
local luup = luup.variable_get( sid, svar, dev )
local endData = (tonumber(now)-tonumber(luup))/86400
return endData
Wanted!
Do you like smart devices and talking to people?
HundredGraphs, a smart energy analytics project, is looking for a co-founder to lead the Community development.
Fun, challenges, and options are included.
Small font: Community Manager will be a cofounder on a part-time basis. The initial reward will be paid in options.