Hi. I have installed and configured Veraflux, Influxdb and Grafana and I see Data are sent. But how can I select a variable in a concrete device to plot it in Grafana?
Concrete device? Or was that an autocorrect for certain device?
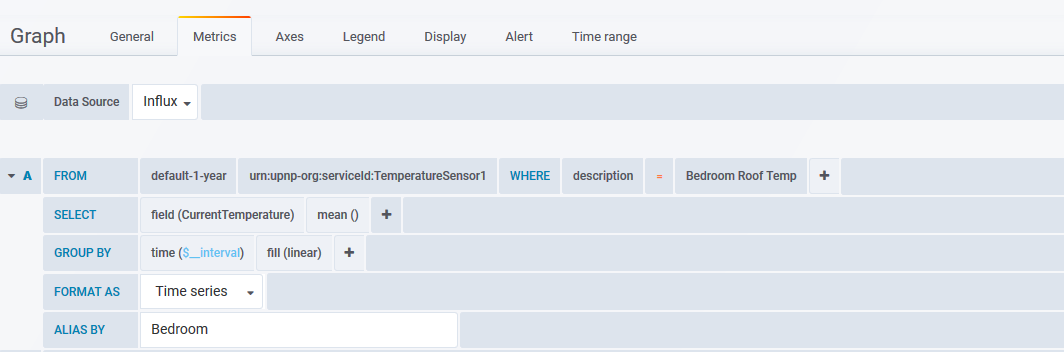
This is an example of how to show a temperature sensor value in Grafana.
Thanks BlueSmurf
That´s what I needed. Gafana is working fine and ploting my sensors info.
Hi,
Does the plugin transmit stats/metrics from the Vera (plus) device itself ?? (eg. CPU / MEM / …) because I can’t seem to find them. without the collectd thing installed I mean.
I read in the description : It currently pulls in data from Vera itself and these services.
Also, my list is a bit smaller, when working on a dash-board I can’t see in the dropdown-list items like ZWaveDevice1 , SystemMonitor etc,etc.
servicesTable['urn:micasaverde-com:serviceId:HaDevice1'] = {}
servicesTable['urn:micasaverde-com:serviceId:ZWaveDevice1'] = {}
servicesTable['urn:upnp-org:serviceId:SwitchPower1'] = {}
servicesTable['urn:upnp-org:serviceId:Dimming1'] = {}
servicesTable['urn:micasaverde-com:serviceId:DoorLock1'] = {}
servicesTable['urn:upnp-org:serviceId:TemperatureSetpoint1'] = {}
servicesTable['urn:upnp-org:serviceId:TemperatureSensor1'] = {}
servicesTable['urn:upnp-org:serviceId:TemperatureSetpoint1_Heat'] = {}
servicesTable['urn:upnp-org:serviceId:TemperatureSetpoint1_Cool'] = {}
servicesTable['urn:micasaverde-com:serviceId:GenericSensor1'] = {}
servicesTable['urn:micasaverde-com:serviceId:LightSensor1'] = {}
servicesTable['urn:micasaverde-com:serviceId:HumiditySensor1'] = {}
servicesTable['urn:micasaverde-com:serviceId:EnergyMetering1'] = {}
servicesTable['urn:micasaverde-com:serviceId:WaterMetering1'] = {}
servicesTable['urn:cd-jackson-com:serviceId:SystemMonitor'] = {}
servicesTable['urn:micasaverde-com:serviceId:SecuritySensor1'] = {}
servicesTable['urn:upnp-org:serviceId:IPhoneLocator1'] = {}
For the rest it works well!
Install the System Monitor plugin and it pulls data from there for CPU/MEM
urn:cd-jackson-com:serviceId:SystemMonitor - is the service ID.
{“memoryFree”, “memoryTotal”, “memoryUsed”, “memoryAvailable”, “cpuLoad1”, “cpuLoad5”, “cpuLoad15”, “systemLuupRestartUnix”, “systemVeraRestartUnix”, “cmhLastRebootUnix”, “uptimeTotal”}
Are the values it’s looking at.
You’ll only see drop downs in Grafana if something has actually been logged for a particular service or field. Some of them like ZWaveDevice1 only watches a single value and I’m not sure it actually gets used. Health: A rating from 0-5. A large number means that MiOS can communicate with it easily.
It was included originally because the definition indicated it might be of interest on a device dashboard.
1 Like
Thanks. works like a charm.
Hi,
Does the plugin has a notion of queuing when the InfluxDB would be unavailable for a short time? Eg. I could store some values for X amount of cycles ?
The plugin doesn’t have any store and forward capability - it would need to be rewritten for that.
It uses the Influx HTTP API to send data on every polling cycle, or for certain devices, whenever they change state (they are watched luup variables). If the API call fails, the error code is logged and the data is discarded.
1 Like
@BlueSmurf, thanks for this good plugin! It works well for the sensordata, but i’m struggling with collectd. It seems to be working on the vera, but i get “502 Bad Gateway” when i try to enable it in InfluxDB… The config of influxdb for collectd isn’t included in your (good) install guide, can you show some example of working settings in the influxdb.conf?
In influxdb.conf I have this section for collectd:
[collectd]
  enabled = true
  bind-address = ":25826"
  database = "collectd"
  typesdb = "/etc/influxdb/types.db"
the types.db file you grab from your collectd install on Vera and copy it to a folder that influx can access (tells influx about the datatypes). Make sure you create the “collectd” database.
I’ve attached my file for convenience.
types.zip (1.8 KB)
Right… I tried that now, putting types.db in the same folder as the .conf file.
When I start the service windows reports an unidentified error, putting the service to “Paused”. when I # the lines again, the service starts up fine.
I did make the collectd database in InfluxDB using Chronograf, so it should be OK on that side.
Any hints on how to debug this? InfluxDB and Grafana is running as a services on a win10 computer…
No Win10 firewall shizzle ?
Don’t think so, the port is open for local communication… And if that was the case, it should result in no data, and not inhibiting influxDB to come up, right?
When I insert/uncomment the lines in .conf, the service won’t start, which seems to be some issue with the conf file…
If you’re running it on Windows, might need to change the types.db reference to use Windows style folder path.
I’m running it on Linux.
Yes, its windows… I managed to get the influxDB service running with the colletd lines in (not sure what fixed it actually), but looking at the startup log, InfluxDB doesnt start the colletd service internally anyway…
I posted this issue in the influxDB commuity, hopefully someone will find the issue… Veraflux and collectd on Vera seems to work, i can see (using wireshark) that both is sending stuff.
Thanks for this great plugin @BlueSmurf !
Works great on a Vera 3.
using influxdb and grafana docker containers on a synology NAS and runs perfectly ![]()
1 Like
Just wanted to mention that also collectd can be enabled on an old Vera 3. Requires some more “adjusting” but it can be done.
Steps different than those mentioned:
paste this in the /etc/opkg.conf file:
src/gz barrier_breaker http://archive.openwrt.org/attitude_adjustment/12.09/ramips/rt288x/packages/
Adjust the /etc/init.d/collectd file before starting the service. See attached file
collectd init.d file.zip (394 Bytes) .
Any experts on influxdb here?
My “server” computer main harddrive died on me, and i’ve done a fresh install on a new disk… Grafana and InfluxDB files were on a different disk, so those files are untouched, but when I run the influxd.exe service, all data seems to be gone? looking at influxdb in Chronograf, all i see is a “_internal” database, the “vera” database is gone…
How is this different from a reboot looking from the influxDB? All files are untouched… Help! its 6 months of lovely data in there somewhere!
I guess its not possible if i havent used backup then? even if the whole /data, /meta and /wal files are intact? I can see the “vera” folder there, but it won’t show up in the “show databases” unless i create a new one…
I tried to get a response on this in the influxdb forum for 6 months, and reached the limit of own-replies without any other replies there… ![]()
@Bluesmurf, I have installed the plugin to monitor my Vera with Grafana… Thanks for making this available!