Has anyone tried to use a profiler to gauge their plugin’s performance or resource use?
I track mine with simple shell scripts that push data to a collection point. Nothing fancy. For Reactor in particular, I use that in conjunction with a python tool I’ve written that allows me to write automated test scripts and run them against the system. It’s easy to correlate activites, and inactivity, to trends in the collected data.
1 Like
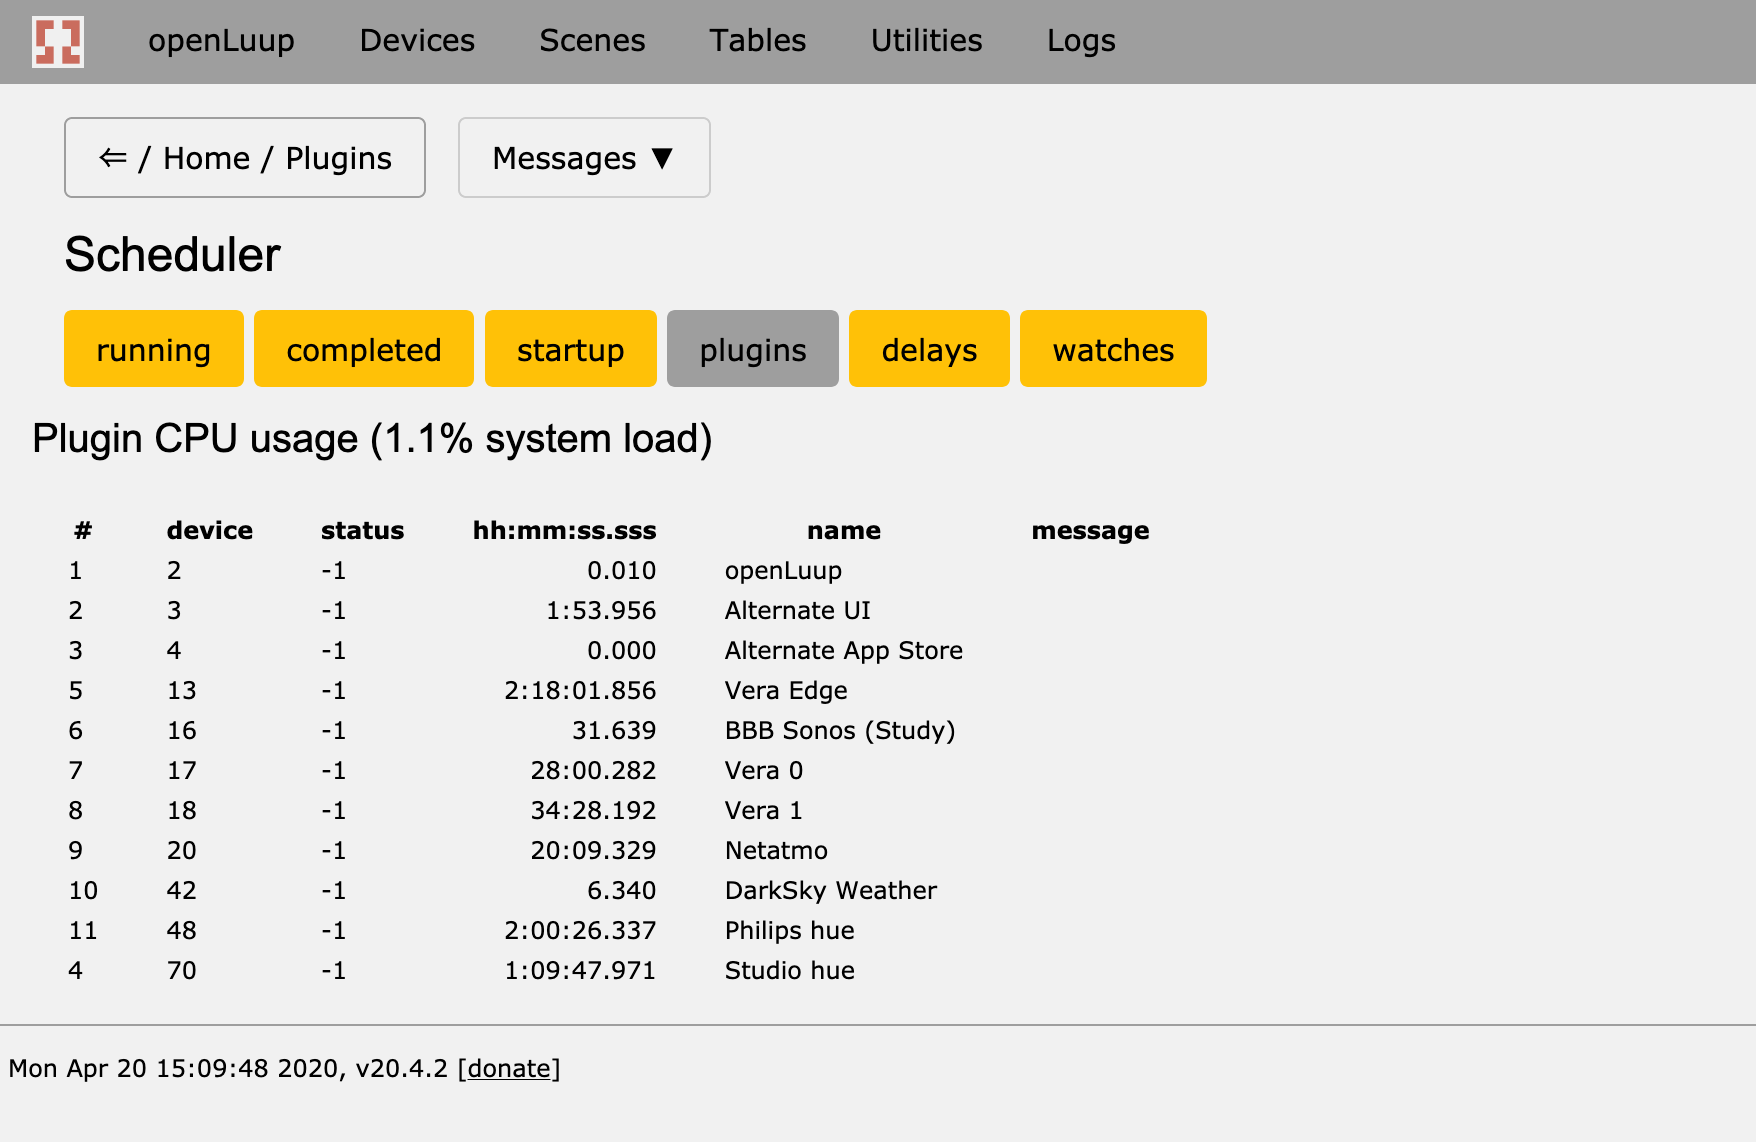
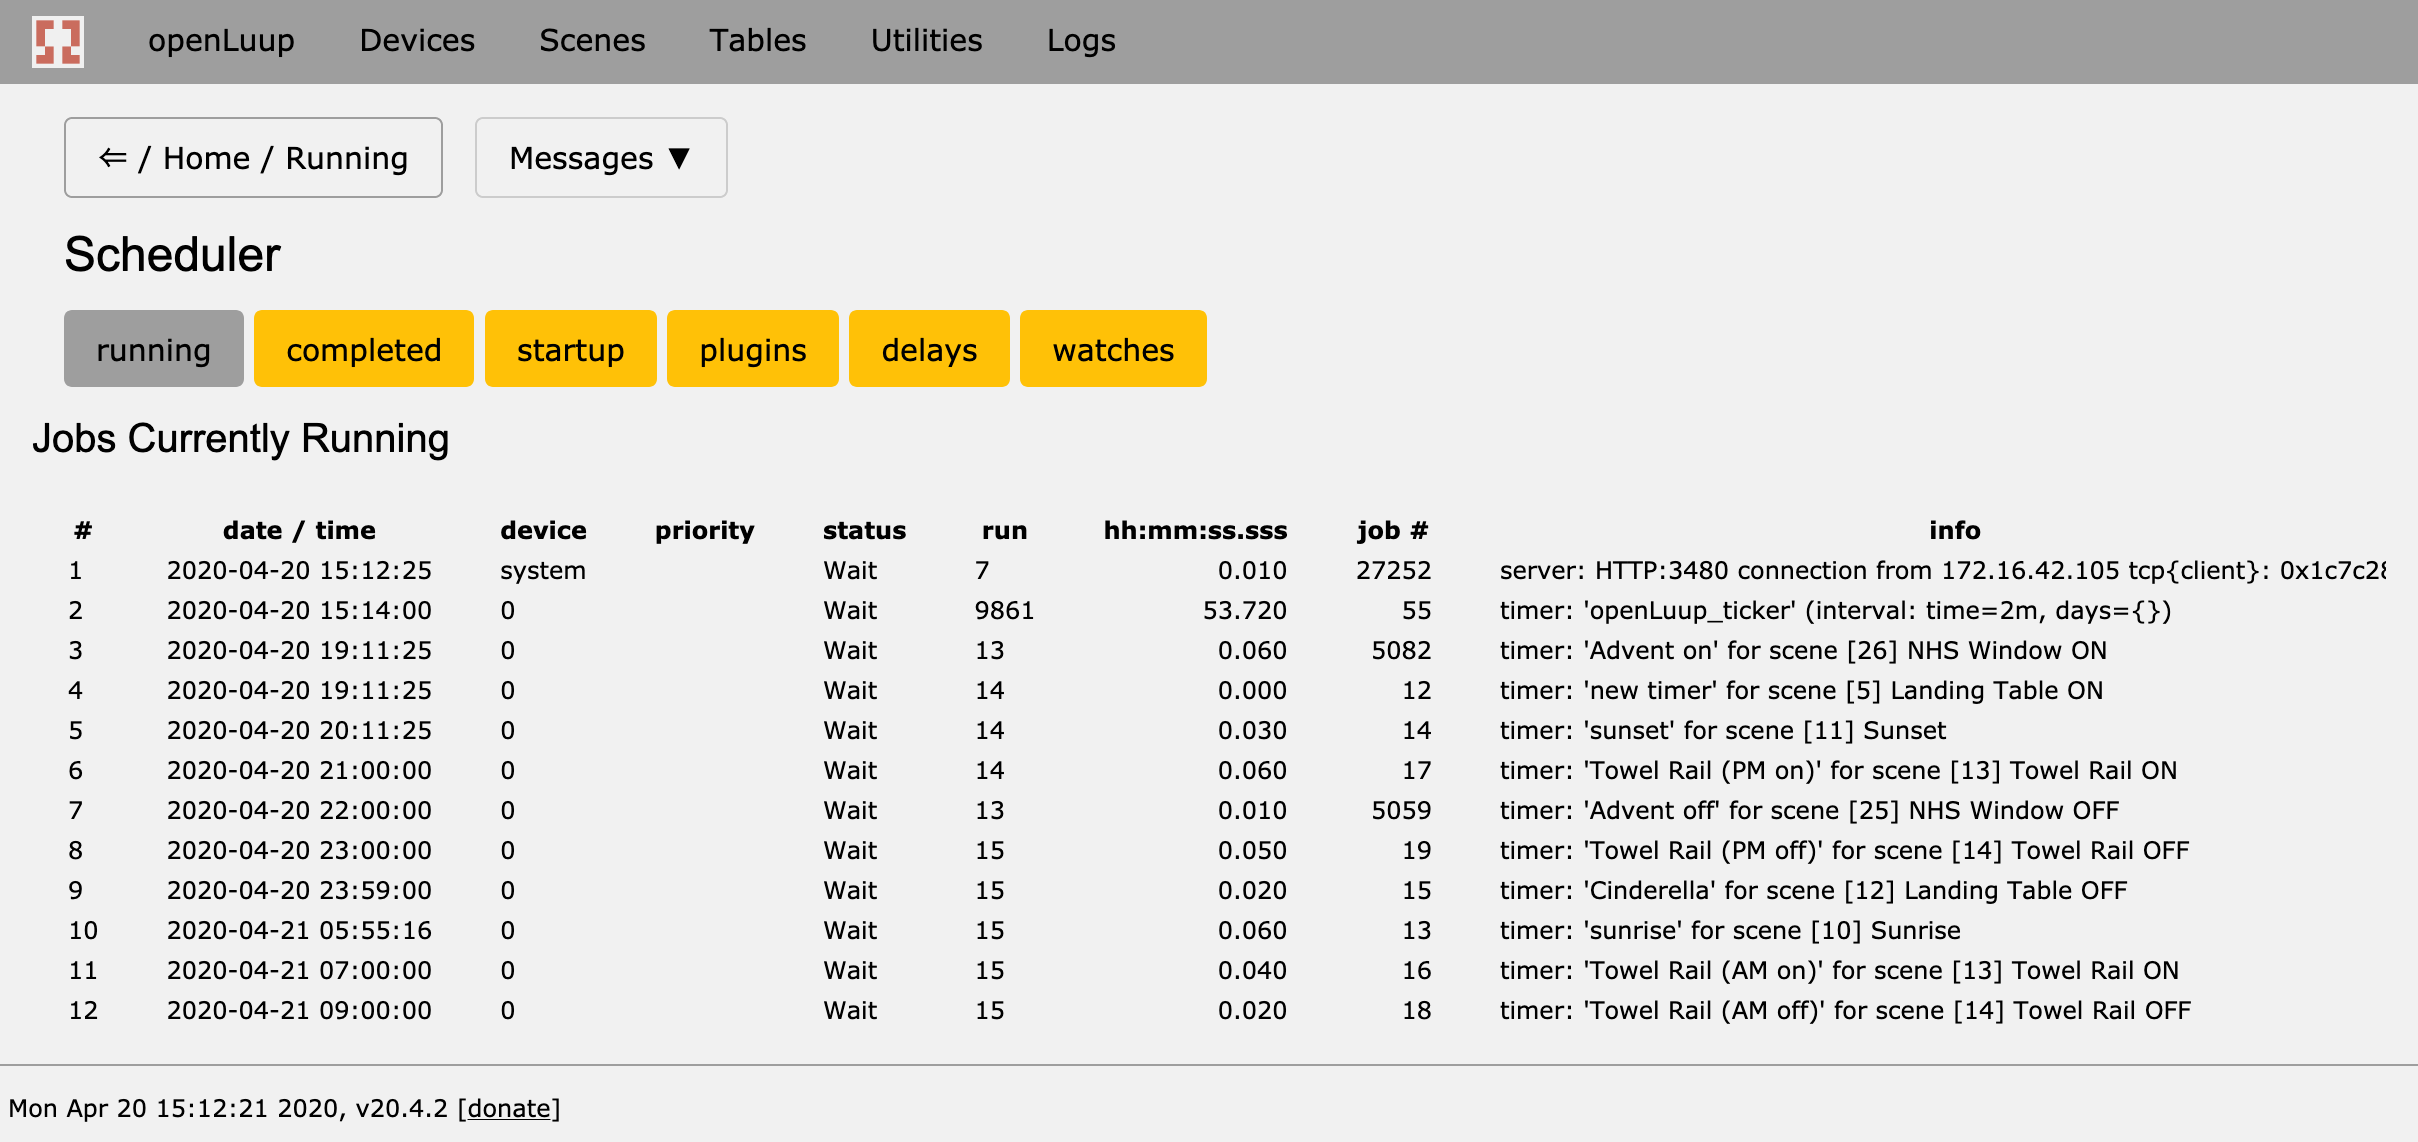
I use openLuup for all my development. CPU usage is recorded by the scheduler and is accessible by code. I’ve recently been considering making these data available on a Console page.
2 Likes