I’ll give this a shot too. Can you screenshot your graph here? Thanks!
Perfect, thanks.
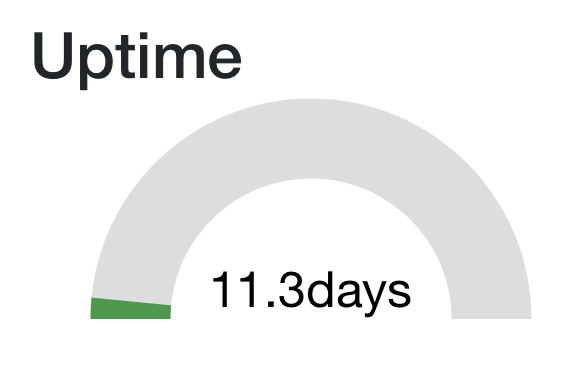
@tunnus thanks. I got mine working now too. So what say you for converting Epoch time of the luup restart from SysMon into something useful such as number of days? I don’t need the exact date/time and HG doesn’t handle that anyhow but same concept here maybe a millisecond value from 1970 to show the number of days since luup restarted.
![]()
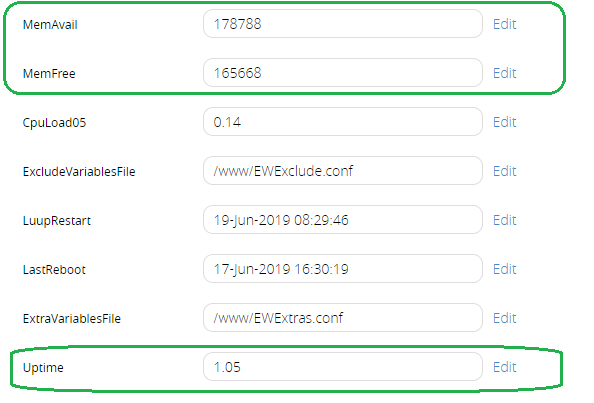
I use EventWatcher to send events from Vera to a Syslog server and if you have the latest version of the EventWatcher plugin there are also some useful variables there that can be sent to HundredGraphs.
local VARIABLES = {
	{ key='Uptime', deviceId = 8, serviceId='urn:akbooer-com:serviceId:EventWatcher1', serviceVar="Uptime" }, -- Send Uptime since last Luup Restart
	{ key='MemAvail', deviceId = 8, serviceId='urn:akbooer-com:serviceId:EventWatcher1', serviceVar="MemAvail" }, -- Send Available Memory
	{ key='MemFree', deviceId = 8, serviceId='urn:akbooer-com:serviceId:EventWatcher1', serviceVar="MemFree" }, -- Send Free Memory
Note: Uptime is since last luup restart
Latest version of EventWatcher can be found from here → GitHub - akbooer/EventWatcher at development
1 Like
@ipstas just noticed that you cannot have a “key” with the same name on different “nodes”. Is this intended behaviour?
Of course, here you go:
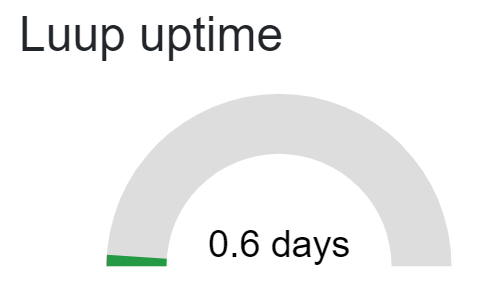
local function cLuupUptime( dev, sid, svar )
	local now = os.time()
    local luup = luup.variable_get( sid, svar, dev )
	local endData = (tonumber(now)-tonumber(luup))/86400
    return endData
end
...
{ key='LuupUptime', calculate=function() return cLuupUptime(265, "urn:cd-jackson-com:serviceId:SystemMonitor", "systemLuupRestartUnix") end, serviceVar="systemLuupRestartUnix" },
Do you need something else? ![]()
All of my devices are showing as “urn:micasaverde-com:serviceId:ZWaveDevice1” … Is that correct? That is different than your examples. Thanks for your help
The service id is related to the device you want to monitor. Rigpapa posted a few pages back to hover the mouse over the variable from the desktop ui and you’ll see what it is. It is entirely possible to all be the same based on what you are monitoring.
The service ids are all the same for plugs and light switches (and everything else). I followed the instructions and configured everything and nothing is showing up on the feed. Perhaps Vera configured them wrong?
You can copy you moniton.lua file here. Hide your API key and I’ll try to help.
– Setup your account at http://hundredgraphs.com
– See API documentation at HundredGraphs, visualize and smarten up your IoT data
– include that in Startup:
– monitcode = require(“Moniton”)
– monitcode.HGTimer(600)
– or you can run it only once like:
– monitcode = require(“Moniton”)
– monitcode.HGTimerOnce()
local pkg = ‘Moniton’
module(pkg, package.seeall)
– API Key
local API_KEY = “***” – grab that KEY from your settings on HundredGraphs, visualize and smarten up your IoT data
local NODE_ID = 1
local TOTAL = ‘Total’
- Log debug messages
local DEBUG = true – if you want to see results in the log on Vera
local remotedebug = false – remote log, you probably don’t need that
local env = ‘[’ … pkg … ‘]’
local Log = function (text) luup.log(env … ’ Logger: ’ … (text or “empty”)) end
– local lastFullUpload = 0
local items = {} – contains items: { time, deviceId, value }
local function cDiff( dev1, dev2, svc, var )
– Log(" getting calculate: " … dev1 … dev2 … svc … var)
local data1 = luup.variable_get( svc, var, dev1 )
local data2 = luup.variable_get( svc, var, dev2 )
local endData = tonumber( data1 ) - tonumber( data2 )
– Log(" calculate cDiff: " … dev1 … dev2 … endData)
return endData
end
local function calcTime( dev, svc, var )
local data = luup.variable_get( svc, var, dev )
local endData = data * 86400
Log(" calculate calcTime: " … dev … endData)
return endData
end
– Setup your devices here. You can use a function to calculate the power as illustrated in the sample.
– For device logging, use: key, deviceId, serviceId, serviceVar
– For function based logging, use: key, calculate, serviceVar
– if you want power to be counted for Total use countTotal=true
local VARIABLES = {
{ key=“DiningRoomLight”, deviceId = 76, serviceId=‘urn:micasaverde-com:serviceId:ZWaveDevice1’, serviceVar=“Watts”, countTotal=true },
{ key=“KitchenLight”, deviceId = 77, serviceId=‘urn:micasaverde-com:serviceId:ZWaveDevice1’, serviceVar=“Watts”, countTotal=true },
{ key=“KitchenCabinets”, deviceId = 49, serviceId=‘urn:micasaverde-com:serviceId:ZWaveDevice1’, serviceVar=“Watts”, countTotal=true },
{ key=“FreezerOutlet”, deviceId = 5, serviceId=‘urn:micasaverde-com:serviceId:ZWaveDevice1’, serviceVar=“Watts”, countTotal=true },
{ key=“LivingRoomCenter”, deviceId = 30, serviceId=‘urn:micasaverde-com:serviceId:ZWaveDevice1’, serviceVar=“Watts”, countTotal=true },
{ key=“LivingRoomLeft”, deviceId = 29, serviceId=‘urn:micasaverde-com:serviceId:ZWaveDevice1’, serviceVar=“Watts”, countTotal=true },
{ key=“LivingRoomRight”, deviceId = 31, serviceId=‘urn:micasaverde-com:serviceId:ZWaveDevice1’, serviceVar=“Watts”, countTotal=true }
– { key=‘House B’, deviceId=13, serviceId=“urn:upnp-org:serviceId:SwitchPower1”, serviceVar=“Status”}, – Send switch status
– { key=‘Computer’, calculate=function() return (IsComputerPingSensorTripped() and 38 or 1) end, serviceVar=“Watts” }, – Send variable value
– { key=‘Other’, calculate=function() return 15 end, serviceVar=“Watts” } – Send a constant value
}
– You shouldn’t need to change anything below this line –
local version = ‘6.19.2019’
local env = ‘[’ … pkg … ‘]’
local p = print
local https = require “ssl.https”
local http = require(‘socket.http’)
https.TIMEOUT = 3
http.TIMEOUT = 3
local BASE_URL = “https://www.hundredgraphs.com/api?key=” … API_KEY
local Log = function (text) luup.log(env … ’ Logger: ’ … (text or “empty”)) end
local items = {} – contains items: { time, deviceId, value }
local function AddPair(key, value)
local item = string.format(“%s:%s”, key, value)
items[#items + 1] = item
end
local function SerializeData()
local dataText = “{” … table.concat(items, “,”) … “}”
return dataText
end
local function ResetData()
items = {}
end
local function SendData()
local data = SerializeData()
local parameters = “&debug=” … tostring(remotedebug) … “&version=” … tostring(version) … “&node=” … tostring(NODE_ID) … “&json=” … data
local url = BASE_URL … parameters
if (DEBUG) then Log(" sending data: " … parameters) end
local _, code = https.request{
url = url,
protocol = “tlsv1_2”,
}
ResetData()
Log(" sent data status: " … code)
return code
end
local function PopulateVars()
local total = 0
local count = 0
for i, v in ipairs(VARIABLES) do
local val
if v.deviceId then
val = luup.variable_get(v.serviceId, v.serviceVar, v.deviceId)
elseif v.calculate then
val = v.calculate()
end
val = tonumber(val) or 0
if v.countTotal == true then
total = total + val
end
val = tostring(val)
AddPair(v.key, val)
count = count + 1
end
AddPair(TOTAL, total)
if (DEBUG) then Log(" collected vars: " … count) end
end
function HGTimerOnce()
PopulateVars()
return SendData()
end
function HGTimer(interval)
interval = interval or updateInterval
PopulateVars()
local code = SendData()
code = tonumber(code)
if (code == 401) then
Log(’ server returned 401, your API key is wrong, HGTimer was stopped, check your lua file ‘)
interval = false
elseif (code == 204) then
Log(’ server returned 204, no data, HGTimer was stopped, check your lua file ‘)
interval = false
else
local res = luup.call_timer(“HGTimer”, 1, interval, “”, interval)
end
if (DEBUG) then Log(’ next in ’ … interval) end
end
_G.HGTimerOnce = HGTimerOnce
_G.HGTimer = HGTimer
if (DEBUG) then Log(" *********************************************** “) end
if (DEBUG) then Log(” started with version " … version … " updateInterval " … updateInterval) end
There might be errors with this file which was one of the latest the last time I checked. Another person I was helping via PM had similar problems.
@ipstas can you review the 6/19 moniton file? I think there’s a problem with it and the quotes and double quotes are out of place in the top 2 devices.
- It should be single quote on device names
- double quotes around service ID
- doulbe quotes around service variable
- check your comas after the } the last line in your file that isn’t commented out should have no comma
- it appears you have a bullet where log debug messages is
- use notepad++ for editing the file, helps with formatting and easier viewing than notepad
- make sure you are using the device ID and not the altid variable. My lock is deviceID 111 but the altid is 19 so double check
- the newer moniton files have more functions added than prior versions. In my file I added a few with the help of this forum so it won’t match all that closely to what you have
- you have spaces in between deviceId, the equal sign, and the number. I don’t and not sure if this matters
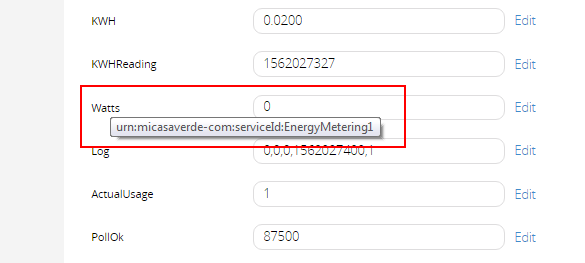
- I don’t think the serviceId should be ZWaveDevice1. I think watts for example would be urn:micasaverde-com:serviceId:EnergyMetering1. So hover your mouse over the variable and see my picture below
You can try to work with mine below:
– Setup your account at http://hundredgraphs.com
– See API documentation at HundredGraphs, visualize and smarten up your IoT data
– include that in Startup:
– monitcode = require(“Moniton”)
– monitcode.HGTimer(600)
– or you can run it only once like:
– monitcode = require(“Moniton”)
– monitcode.HGTimerOnce()
local pkg = ‘Moniton’
module(pkg, package.seeall)
– API Key
local API_KEY = “hidden” – grab that KEY from your settings on HundredGraphs, visualize and smarten up your IoT data
local NODE_ID = 1
local TOTAL = ‘Total’
– Upload Frequency in seconds. We do not accept updates more often than 60 sec,
– Do NOT try to send updates from different devices with the same node_id and API key,
– Incoming data is discarded if the previous one was not 60 sec old
local updateInterval = 600
– Log debug messages
local DEBUG = true
local remotedebug = false
– Setup your devices here. You can use a function to calculate the power as illustrated in the sample.
– For device logging, use: key, deviceId, serviceId, serviceVar
– For function based logging, use: key, calculate, serviceVar
– if you want power to be counted for Total use countTotal=true
local function cUptime(dev, sid, svar)
local secs = luup.variable_get( sid, svar, dev )
local endData = tonumber(secs)/86400
return endData
end
local function cLuupUptime( dev, sid, svar )
local now = os.time()
local luup = luup.variable_get( sid, svar, dev )
local endData = (tonumber(now)-tonumber(luup))/86400
return endData
end
local VARIABLES = {
{ key=‘LockBattery’, deviceId=111, serviceId=“urn:micasaverde-com:serviceId:HaDevice1”, serviceVar=“BatteryLevel”},
{ key=‘InsideTemp’, deviceId=116, serviceId=“urn:upnp-org:serviceId:TemperatureSensor1”, serviceVar=“CurrentTemperature”},
{ key=‘SetPoint’, deviceId=116, serviceId=“urn:upnp-org:serviceId:TemperatureSetpoint1”, serviceVar=“CurrentSetpoint”},
{ key=‘OutsideTemp’, deviceId=232, serviceId=“urn:upnp-org:serviceId:TemperatureSensor1”, serviceVar=“CurrentTemperature”},
{ key=‘CPULoad’, deviceId=233, serviceId=“urn:cd-jackson-com:serviceId:SystemMonitor”, serviceVar=“cpuLoad1”},
{ key=‘TotalMemory’, deviceId=233, serviceId=“urn:cd-jackson-com:serviceId:SystemMonitor”, serviceVar=“memoryTotal”},
{ key=‘MemoryUsed’, deviceId=233, serviceId=“urn:cd-jackson-com:serviceId:SystemMonitor”, serviceVar=“memoryUsed”},
{ key=‘GarageMotionSensorBattery’, deviceId=213, serviceId=“urn:micasaverde-com:serviceId:HaDevice1”, serviceVar=“BatteryLevel”},
{ key=‘BackBathroomDoorBattery’, deviceId=227, serviceId=“urn:micasaverde-com:serviceId:HaDevice1”, serviceVar=“BatteryLevel”},
{ key=‘SalinityValue’, deviceId=236, serviceId=“urn:upnp-org:serviceId:VContainer1”, serviceVar=“Variable1”},
{ key=‘pHValue’, deviceId=236, serviceId=“urn:upnp-org:serviceId:VContainer1”, serviceVar=“Variable2”},
{ key=‘ChlorineValue’, deviceId=236, serviceId=“urn:upnp-org:serviceId:VContainer1”, serviceVar=“Variable3”},
{ key=‘SalinityIdeal’, calculate=function() return 3800 end, serviceVar=“Watts” }, – Send a constant value
{ key=‘pHIdeal’, calculate=function() return 7.4 end, serviceVar=“Watts” }, – Send a constant value
{ key=‘ChlorineIdeal’, calculate=function() return 1.3 end, serviceVar=“Watts” }, – Send a constant value
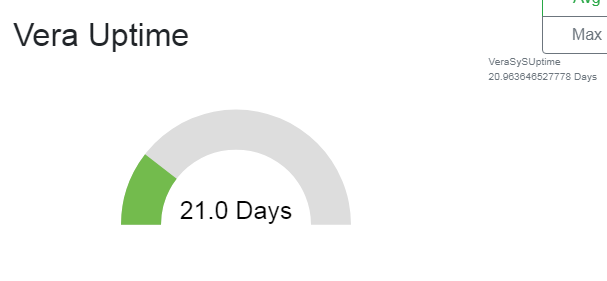
{ key=‘VeraSySUptime’, calculate=function() return cUptime(233, “urn:cd-jackson-com:serviceId:SystemMonitor”, “uptimeTotal”) end, serviceVar=“uptimeTotal”},
{ key=‘LuupUptime’, calculate=function() return cLuupUptime(233, “urn:cd-jackson-com:serviceId:SystemMonitor”, “systemLuupRestartUnix”) end, serviceVar=“systemLuupRestartUnix” }
– { key=‘LuupRestart’, deviceId=233, serviceId=“urn:cd-jackson-com:serviceId:SystemMonitor”, serviceVar=“systemLuupRestartUnix”},
– { key=‘VeraUptime’, deviceId=233, serviceId=“urn:cd-jackson-com:serviceId:SystemMonitor”, serviceVar=“uptimeTotal”},
– { key=‘Computer’, calculate=function() return (IsComputerPingSensorTripped() and 38 or 1) end, serviceVar=“Watts” }, – Send variable value
– { key=‘House B’, deviceId=13, serviceId=“urn:upnp-org:serviceId:SwitchPower1”, serviceVar=“Status”}, – Send switch status
– { key=‘Computer’, calculate=function() return (IsComputerPingSensorTripped() and 38 or 1) end, serviceVar=“Watts” }, – Send variable value
}
– You shouldn’t need to change anything below this line –
local version = ‘5.15.2019’
local env = ‘[’ … pkg … ‘]’
local p = print
local https = require “ssl.https”
local http = require(‘socket.http’)
https.TIMEOUT = 3
http.TIMEOUT = 3
local BASE_URL = “https://www.hundredgraphs.com/api?key=” … API_KEY
local Log = function (text) luup.log(env … ’ Logger: ’ … (text or “empty”)) end
local items = {} – contains items: { time, deviceId, value }
local function AddPair(key, value)
local item = string.format(“%s:%s”, key, value)
items[#items + 1] = item
end
local function SerializeData()
local dataText = “{” … table.concat(items, “,”) … “}”
return dataText
end
local function ResetData()
items = {}
end
local function SendData()
local data = SerializeData()
local parameters = “&debug=” … tostring(remotedebug) … “&version=” … tostring(version) … “&node=” … tostring(NODE_ID) … “&json=” … data
local url = BASE_URL … parameters
if (DEBUG) then Log(" sending data: " … parameters) end
local _, code = https.request{
url = url,
protocol = “tlsv1_2”,
}
ResetData()
Log(" sent data status: " … code)
return code
end
local function PopulateVars()
local total = 0
local count = 0
for i, v in ipairs(VARIABLES) do
local val
if v.deviceId then
val = luup.variable_get(v.serviceId, v.serviceVar, v.deviceId)
elseif v.calculate then
val = v.calculate()
end
val = tonumber(val) or 0
if v.countTotal == true then
total = total + val
end
val = tostring(val)
AddPair(v.key, val)
count = count + 1
end
AddPair(TOTAL, total)
if (DEBUG) then Log(" collected vars: " … count) end
end
function HGTimerOnce()
PopulateVars()
return SendData()
end
function HGTimer(interval)
interval = interval or updateInterval
PopulateVars()
local code = SendData()
code = tonumber(code)
if (code == 401) then
Log(’ server returned 401, your API key is wrong, HGTimer was stopped, check your lua file ‘)
interval = false
elseif (code == 204) then
Log(’ server returned 204, no data, HGTimer was stopped, check your lua file ‘)
interval = false
else
local res = luup.call_timer(“HGTimer”, 1, interval, “”, interval)
end
if (DEBUG) then Log(’ next in ’ … interval) end
end
_G.HGTimerOnce = HGTimerOnce
_G.HGTimer = HGTimer
if (DEBUG) then Log(" *********************************************** “) end
if (DEBUG) then Log(” started with version " … version … " updateInterval " … updateInterval) end

Not in hundred graphs that I know of. When I used to use datamine, you could make the variable value such as a word equal a number. Currently it doesn’t appear possible in hundred graphs.
Saw this go by… I just did a quick enhancement to the Virtual Sensor plugin to allow you to set the state of a binary sensor to the result of a match against a value. This would allow you to have a virtual binary/security sensor’s tripped state be 1 when ModeStatus is “CoolOn” and 0 otherwise.
Of course you could do this with Reactor with one match condition, but that’s a big bat to hit this small problem with if you’re not already using Reactor, so seems like a natural add directly into Virtual Sensor. If you’re interested in trying it, let me know and I’ll walk you through the steps. There’s no UI for it currently, so you’d need to set state variables directly; I’ll get around to the UI later.
1 Like
I would certainly like this in the ui. What might cause the graphs to go awry is the value chosen for on and off. When I used datamine, I had to make off 100 and on 50 because I was overlaying outside temp, inside temp, and setpoint. If you didn’t do this, the value range in the chart would scrunch the numbers or a low value would be difficult to see.
However, in hundred graphs I don’t think you can do a bar chart with a line chart on it like I did in datamine. Hope that makes sense.
It will give you 0 or 1–matched the string or did not. If you need a different range to overlay with that, I suggest using an expression in a ReactorSensor to track the ModeStatus variable and generate values in the range you need.

then you would use coolon as the (serviceVar=“coolon?”}
so theoretically i ca write an if statement for 0= hvac off -1 =heaton aand 1= cooolon